These 2 Digital Marketing Metrics are All Your Marketing Boss Needs, to Know You are a Star.
Digital Marketers everywhere need to make sure that the online campaign metrics or KPIs (Key Performance Indicators) Â they are using in their reports are meaningful to their bosses and aligned with the overall company KPIs.
Busy decision makers don’t have the time to go through the dozens and dozens of metrics that online marketing professionals use to evaluate the success of their campaigns. So often times they don’t even try to understand what these KPIs are about and what they mean.
And that makes it hard for us marketers to prove the value we are creating for the company.
The reality is that more is not always better. And sometimes quality really beats quantity. So if you want your marketing boss to listen and most of all, appreciate the awesome things that you have been doing, all you need to do is to teach them just 2 digital marketing metrics.
These 2 KPIs are enough to give an instant measure as to the quality of any digital marketing campaign in 2 minutes or less. And this is exactly what this blog is about.
Here, I will focus on introducing these metrics and showing why they are so important and how they can help identify potential bottlenecks.
The second part of the series will cover how these metrics work to highlight –instantly – if a marketing team is maximizing the return on their campaign efforts or leaving money on the table.
Online Marketing Campaigns and the Importance of Landing Pages
All digital marketing campaigns lead to a landing page. This property, which could either be a stand-alone page or part of your corporate website, is where ultimately leads are created. A landing page will always have an online form, accompanied by some type of an offer, and a subsequent “Thank you” version, where visitors who fill out the form are being re-routed to.
Are landing pages really something to worry about?
A couple of months ago, a marketing decision-maker asked me about the importance of landing pages and how they contribute to the success of an online marketing campaign. My answer was that they can pretty much make or break a campaign, so their performance needs to be monitored and optimized at all times.
I used ROI metrics from an actual eBook download campaign I have been working on to show that one can be great at generating traffic to a landing page and still fail to drive effective return on their marketing investment if the visitors are not convinced by the value proposition communicated on the page.
In this particular campaign, we were running a stream of highly engaging tweets, pay-per-click ads, and LinkedIn posts, and were able to get thousands of visitors on our landing page. Unfortunately, the majority of them left without filling out our online form. That pretty much ended up putting the campaign in serious peril.
You say tom[ei]to, but instead of thinking tom[a:]to, people get apple
I wanted to show the decision maker how we knew that the landing page quality was our bottleneck. So, I shared a screen grab from Google Analytics. I thought that using visuals would be a good way to explain that despite the great number of visits, our landing page wasn’t working for us because it had a whopping 90% bounce rate.
To my surprise, the senior manager responded very positively to the 90% that Google was showing us. He said that he is actually very pleased to see such positive results because they mean that 10 out of every 100 visitors will stay on the page, which is actually a pretty good number as far as he is concerned.
I quickly understood that we were not comparing apples to apples. And I needed to address this.
Why digital marketing KPIs have to be correlated with relevant business metrics
That digitally focused campaigns have delivered great results, which cannot be achieved with traditional media, is clear to everyone. Organizations will continue to invest in digital marketing because technology not only enables us to build more and more amazing online campaigns; it also empowers us to both see how these tactics are performing in real time and continually improve their quality to get higher returns on our investment.
But one thing that digital marketers need to do is make sure that the KPIs (Key Performance Indicators) they are using in their reports are meaningful to their bosses and aligned with the overall company KPIs.
Getting on the same page and speaking the same language ensures that the digital team is able to communicate effectively the value they are creating.
It also enables the marketing bosses to align digital success metrics with the company’s bottom line and to be more proactive in “marrying” digital goals and results with those of the rest of the functions across the business.
Here are the 2 Digital Marketing Metrics that Will Let Anyone Gauge Instantly if a Campaign will be a Success or a Mess
These two metrics are awesome because they give every marketer a really quick way to gauge both campaign sustainability and the quality of their digital team’s work without the need to spend too much time on in-depth reports or analysis.
What is Bounce Rate and why is it so important

What is a good Bounce Rate
As Elisha Hartwig of Mashable puts it: “On the Internet, a high bounce rate is the kiss of death — and a sure sign that your website and marketing strategy need a major overhaul.â€2
RocketFuel provides a more numbers-focused approach, elaborating that “anything under 40% that’s not the result of a broken GA [Google Analytics] installation is excellent, and indicative of a well built, professionally designed website that is meeting its users’ needs.â€3
A targeted landing page, optimized for social media or paid search, is considered to perform well when its bounce rates are on average between 50% and 65%, although these numbers could vary depending on your industry. As a rule of thumb, though, anything over 70% is “disappointing for everything outside of blogs, news, events…â€3
When to get really worried about your Bounce Rates and campaign outcomes
So if your team is driving steady, high intent event registration traffic from Search, LinkedIn or Twitter and your bounce rates end up being 90%, that means you have a problem – either your ads, tweets, and posts are misleading visitors or your page is killing your campaign. If you have time to delve more into the whats and hows of landing page issues, here is an excellent blog that showcases 21 reasons why a landing page could be undermining a campaign’s success. The good news is that the article also offers abundant advice and guidance on how to address each issue, so it is a really good read.
Now that I have covered bounce rates, let me go over conversion rates.
What is Conversion Rate & how does it affect a company’s bottom line
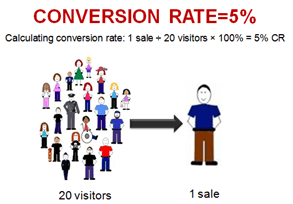
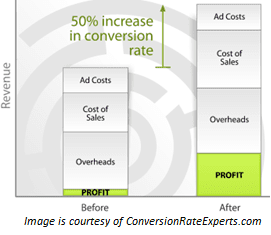
To explain why conversion rates are so critical for digital marketing, Sara Helmy, CEO of Tribu, says: “Depending on the campaign, a conversion can be the number of people who filled out a contact form, made a purchase, clicked on an email or signed a petition — whatever action leads to accomplishing the overall goal. Conversion rate is by far the biggest indicator of whether or not our efforts, as a marketing agency, are successful.“ 4
What is a good Conversion Rate
An average conversion rate of 4% – 6% is generally considered good, although WordStream’s CTO Larry Kim would be the first to ask you “Do you want to be average, or do you want your account to perform exponentially better than others in your industry?â€******
He will also tell you this: “If you’re comparing yourself to the average across all industries, you’re really deluding yourself into thinking you’re doing better than you are. In truth, the top 10% are doing almost five times better.†******
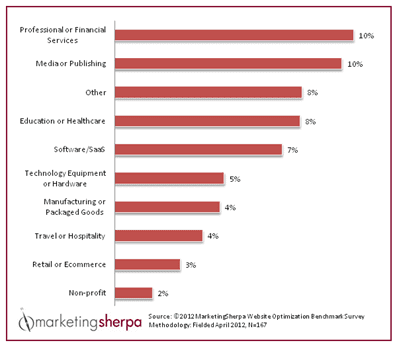
Here are a few Conversion Rate averages, based on a 2012 report from Marketing Sherpa:
Conclusion
Bounce rates work together with conversion rates to showcase how well a campaign executes a company’s marketing & lead/sales generation strategy. In this blog post, I introduced the 2 metrics and gave you a brief overview of what they mean and how they are used in digital marketing.
Now that you have become a bounce and conversion rates expert, Â it is time to move to part 2 of the series and learn how to use these metrics to get instant insight into the quality of your marketing campaigns.
The two KPIs serve as a great proxy to any elaborate analytics report, giving you instant “rule-of-thumb†assessment of the quality of any online campaign and its ability to achieve the goals you have set.
While nothing can replace an in-depth analytics report, coupled with well-outlined intelligence and data-driven recommendations, busy decision makers who are juggling many projects can save time and still get a pretty realistic picture relative to their team’s successes by using just these two metrics.  You can continue to Part 2 of this series here.
““““““““““““““““““““
List of references:


